Prof. Dr. Alfons Hugger, Poliklinik für Zahnärztliche Prothetik, Universitätsklinikum Düsseldorf
This website provides a tool for a fully automatic particle analysis of chewed material for evaluating the chewing efficiency.
The uploaded images must have at least a resolution of 600×600 dpi. If no resolution is specified in the image header, a resolution of 1200×1200 dpi is assumed. Please make sure that the background of your images is as dark as possible. This can be achieved by a black background covering the scanning disc in a certain distance.
The image is automatically analyzed after uploading. The analysis takes about one and a half minute. The processing time will be improved significantly in the future. The analysis creates each uploaded image xyz.jpg four files xyz_evaluation.png, xyz_evaluation.txt, xyz_evaluation.csv and xyz_evaluation_de.csv.
The image is first transformed into a gray scale image and then into a 0/1 black and white image using a brightness threshold of 0.5. The brightness of the brightest pixel corresponds to the value 1, the brightness of the darkest pixel corresponds to the value 0. For each connected white area with a minimum size of 0.01 mm² (to separate a particle from the dust) several geometrical parameters are calculated. Some of these parameters are the 2-dimensional area size, the minor axial length of the best fitting ellipse, and the min feret diameter. These values are drawn into the black and white image saved under the name xyz_evaluation.png. Then the particles are analyzed by several different methods.


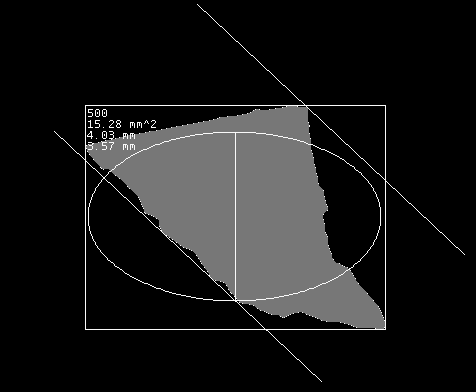
In the black and white image xyz_evaluation.png, each particle is surrounded by a bounding box. In the upper left corner is the particle number, the area size in mm², the min feret diameter in mm and the minor axis length in mm. The min feret diameter is the distance between the two parallel lines. The minor axis length is the length of the line in the middle of the ellipse. Currently, the fitting ellipse is not drawn at the correct place with the correct orientation. This will be changed in the future.
The file xyz_evaluation.txt contains the evaluation in text format. The files xyz_evaluation.csv and xyz_evaluation_de.csv contain the evaluation results by comma separated values. In the file with the supplement "de", in all number representations the decimal point is replaced by a comma. We also provide an Excel template to visualize the data of the evaluation. This template uses the data from the csv-files.
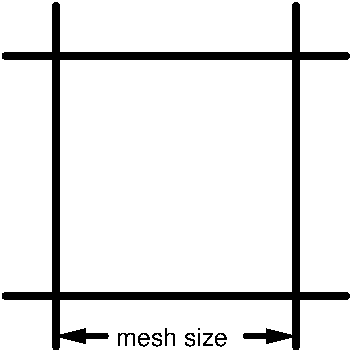
The method of [ESHSRG12] tries to simulate the manual sieving process. It considers sieves of 10 fixed mesh sizes between 0.25 mm and 5.6 mm. It tries to calculate the weight of all particles which would remain in a sieve of a certain mesh size if the particles of the chewing sample would be separated by manual sieving.
The particles are assigned to the mesh sizes of the sieves depending on the following conditions for the min feret diameter and the 2-dimensional area size. The assignment of a particle to a sieve mesh size means that the particle would remain at a sieve of this mesh size. The volume of a particle is estimated by the product of the 2-dimensional area size multiplied by the half-length of the minor axis length of the best fitting ellipse. The estimated volumes of the particles assigned to a mesh size are summed up.
The authors of [ESHSRG12] distinguish between two types of chewing material, called Optosil and Optical.
| Mesh size | min feret condition | area size condition |
|---|---|---|
| 0.00 mm | min feret ≤ 0.2117 mm | area ≤ 4.130 mm² |
| 0.25 mm | 0.2117 mm < min feret ≤ 0.4233 mm | area ≤ 4.130 mm² |
| 0.35 mm | 0.4233 mm < min feret ≤ 0.5778 mm | area ≤ 4.130 mm² |
| 0.50 mm | 0.5778 mm < min feret ≤ 0.8674 mm | area ≤ 4.130 mm² |
| 0.71 mm | 0.8674 mm < min feret ≤ 1.169 mm | area ≤ 4.130 mm² |
| 1.0 mm | 1.169 mm < min feret ≤ 1.594 mm | area ≤ 4.130 mm² |
| 1.4 mm | 1.594 mm < min feret | area ≤ 4.130 mm² |
| 2.0 mm | 1.594 mm < min feret | 4.130 mm² < area ≤ 11.13 mm² |
| 2.8 mm | 1.594 mm < min feret | 11.13 mm² < area ≤ 18.84 mm² |
| 4.0 mm | 1.594 mm < min feret | 18.84 mm² < area ≤ 36.99 mm² |
| 5.6 mm | 1.594 mm < min feret | 36.99 mm² < area |
| Mesh size | min feret condition | area size condition |
|---|---|---|
| 0.00 mm | area ≤ 0.01344 mm² | |
| 0.25 mm | 0.01344 mm < area ≤ 0.02802 mm² | |
| 0.35 mm | 0.02802 mm² < area ≤ 0.2899 mm² | |
| 0.50 mm | 0.2899 mm² < area ≤ 0.7590 mm² | |
| 0.71 mm | 0.7590 mm² < area ≤ 1.457 mm² | |
| 1.0 mm | 1.457 mm² < area ≤ 3.300 mm² | |
| 1.4 mm | 3.300 mm² < area ≤ 5.912 mm² | |
| 2.0 mm | 5.912 mm² < area ≤ 10.60 mm² | |
| 2.8 mm | 10.60 mm² < area ≤ 19.25 mm² | |
| 4.0 mm | 19.25 mm² < area ≤ 38.79 mm² | |
| 5.6 mm | 38.79 mm² < area |
The volume was estimated by the area size multiplied by half of the minor axis length. The following experimentally determined correction factors correct the volume calculations depending on the mesh size.
| Mesh size | correction factor |
|---|---|
| 0.00 mm | 0.0 |
| 0.25 mm | 0.3 |
| 0.35 mm | 0.6549 |
| 0.50 mm | 0.5658 |
| 0.71 mm | 0.6018 |
| 1.0 mm | 0.65 |
| 1.4 mm | 0.6922 |
| 2.0 mm | 0.5 |
| 2.8 mm | 0.9 |
| 4.0 mm | 0.8 |
| 5.6 mm | 0.5 |
This particle analysis calculates for each min feret diameterm, each r the volume of all particles with a min feret diameter > r. The reference parameter "min feret diameter" can be replaced by other parameters as for example the "minor axis length" or the "area size". The example for the reference parameter "min-ferrite diameter" is included in the current evaluation.
To calculate the mesh size xi at which a given fraction yi of the total volume remains, the used (xi, yi) pairs are interpolated by a Rosin Rammler function
f(x) = e-(x / a)b
for two positive numbers a (the Rosin Rammler diameter) and b (the Rosin Rammler exponent), where x is the mesh size ≥ 0 and f(x) with 0 ≤ f(x) ≤ 1 is the relative volume sum of the particles retained in a sieve of mesh size x.
The Rosin Rammler coefficients a and b are determined from the given mesh size / retained pairs (x1,y1), ..., (xn,yn) as follows. The value for the Rosin Rammler diameter a is determined by f(a) = e-1 = 0.367879. That is, we calculate the index i for wich yi < e-1 ≤ yi+1. If such an index i does not exist, then there are not enough values for computing a sufficiently good interpolation. Coefficient a is now linearly interpolated by a = xi + (xi+1 - xi)(yi - e-1) / (yi - yi+1).
With this Rosin Rammler diameter a, we compute for each pair (xi,yi) with xi ≠ a and yi > 0 the values
bi = ln(-ln(yi)) / ln(yi / a)
for i = 1,...,n and the arithmetic mean b of all these bi's. Based on these two coefficients a and b, the final Rosin Rammler diameter a and exponent b are calculated by local improvements to minimize the sum of all (f(xi) - yi)2 for i = 1,...,n.
The Rosin Rammler function can be inverted by taking logs of both sides and rearranging to
x = a (-ln(y))(1 / b).
This allows the calculation of a specific mesh size x, not present in an input pair, for a given relative volume y that would remain in a sieve with a mesh size of diameter x. This value is denoted by xy. For example, if y is given in percent, then x50 is the Rosin Rammler diameter at which half the volume would retain.
[ESHSRG12] L. Eberhard, H.J. Schindler, D. Hellmann, M. Schmitter, P. Rammelsberg, N.N. Giannakopoulos, Comparison of particle‐size distributions determined by optical scanning and by sieving in the assessment of masticatory performance, Journal of Oral Rehabilitation, 2012, Volume 39, Issue 5, 338-348
If you have any questions about the analysis, please contact Egon.Wanke@hhu.de.